Breakpoints lie.
Halting a chip to inspect it freezes timers, drops interrupts, and destroys the timing-dependent bug you were chasing. Race conditions, priority inversions, missed deadlines, jitter: they vanish the moment you stop to look.
The state of the art, 2026
Every other software domain got observability, tracing, and an AI copilot. The 30 billion microcontrollers the cloud forgot got almost none of it.
Today's AI can write firmware, compile, and flash onto a device. Then it goes blind.
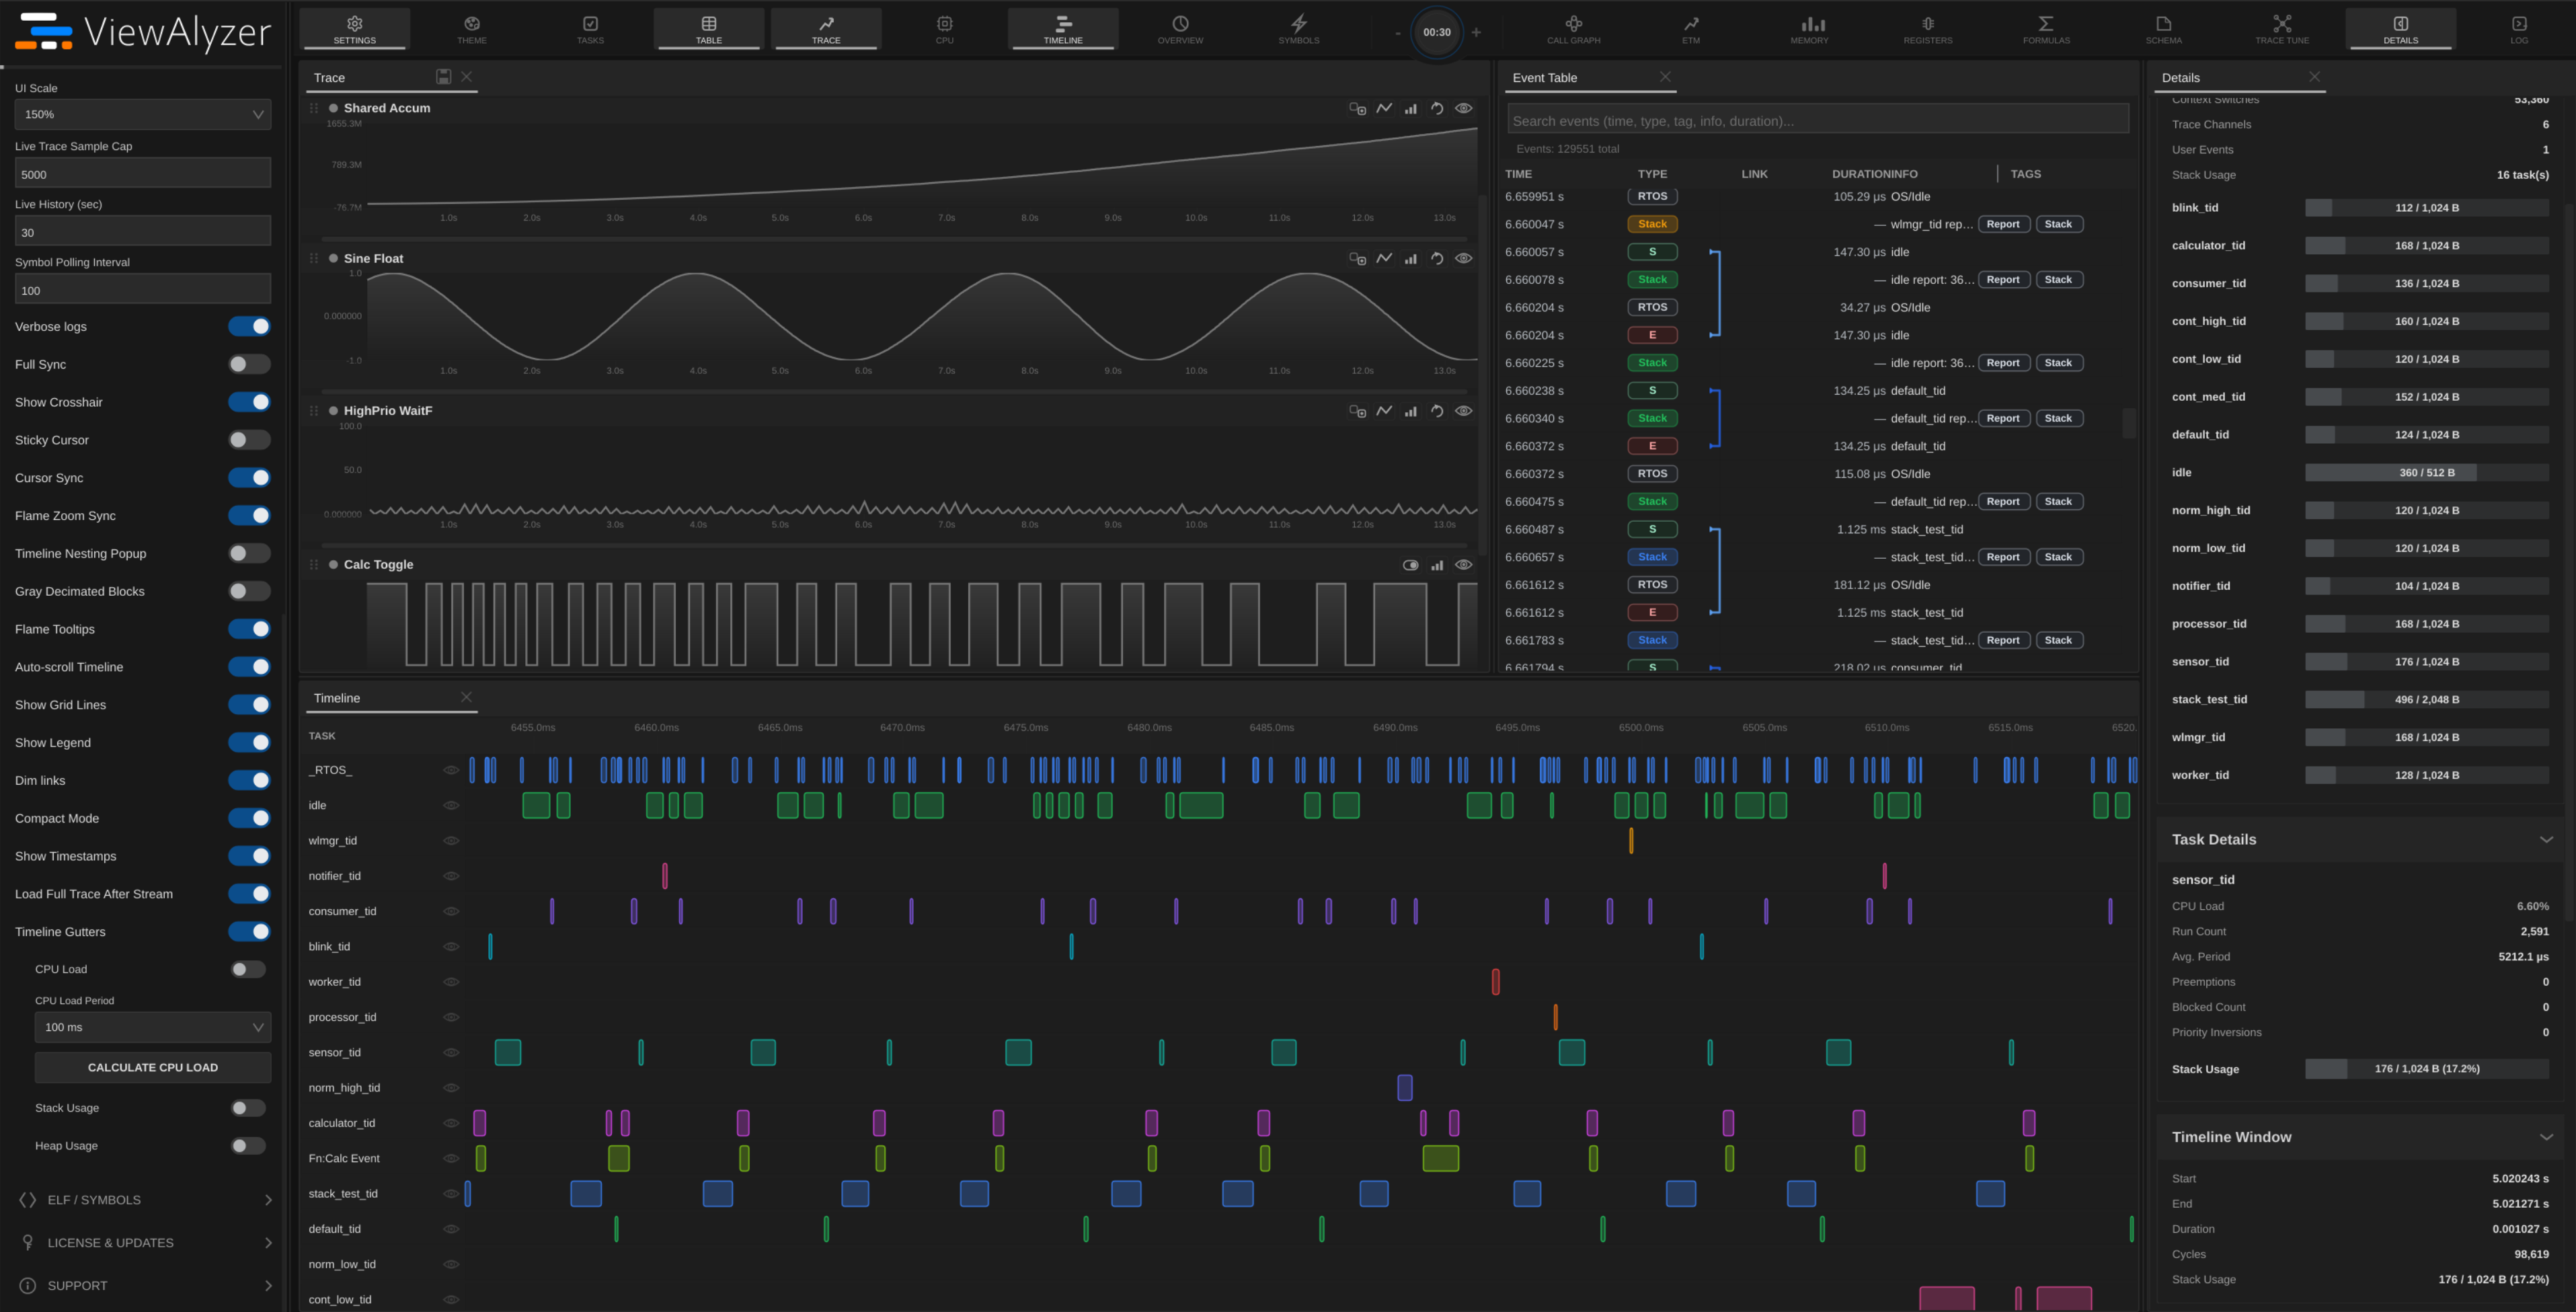
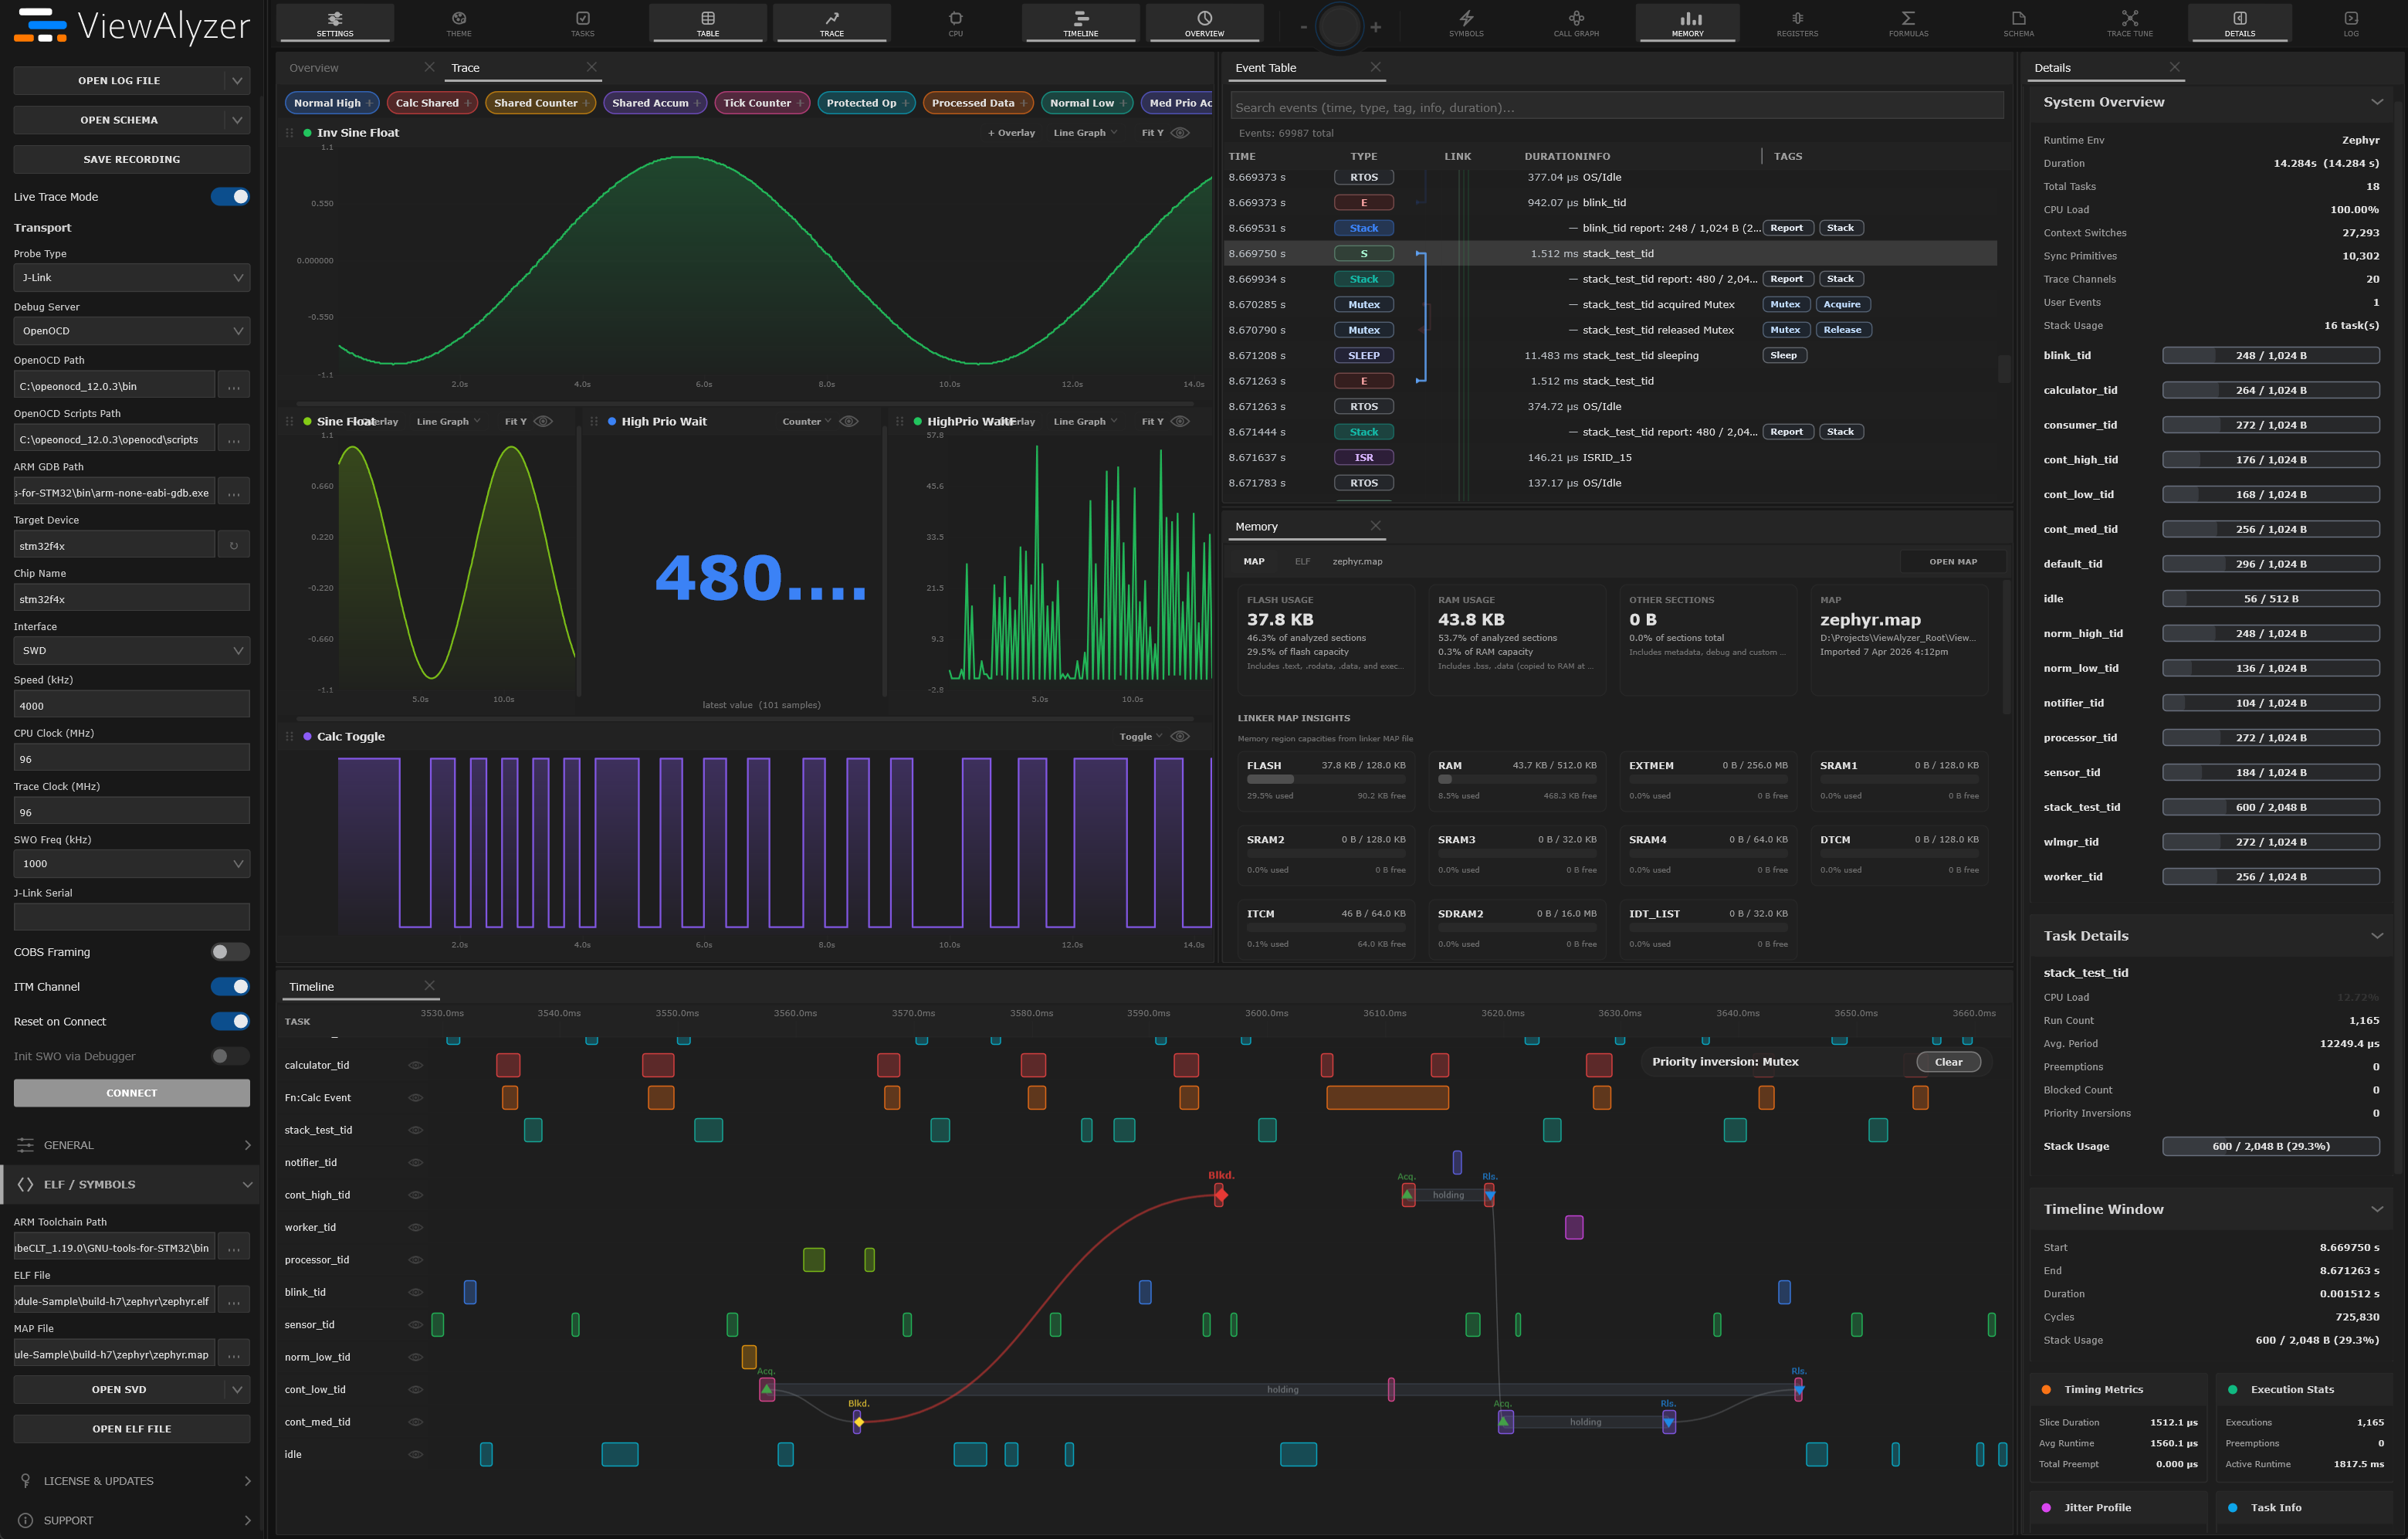
ViewAlyzer closes that gap. A rewind button for embedded systems: recorded time-travel through real execution paths. ViewAlyzer is the observability layer for embedded systems serving any AI agent or engineer that needs to understand what happened on a device.
01 The wedge: the 5-figure wall
For the last 20 years, embedded trace tooling has lived in a high-priced, low-velocity world of specialized bench instruments. A modern, software-defined approach is overdue: always-on observability, powerful tracing, and AI-native workflows. But not AI-dependent.
The only thing standing between engineers and a full recording of what their code did has been the cost of capturing and decoding it: bench instruments priced like capital equipment.
ViewAlyzer collapses that cost into software, so the market multiplies instead of splits. The probe gets developers in; the software and agent are where the value compounds.
02 The problem
There are tens of billions of microcontrollers running real-time code in the world. The people who debug them are still using tools from another decade, and the act of looking destroys the very behavior they're chasing.
Halting a chip to inspect it freezes timers, drops interrupts, and destroys the timing-dependent bug you were chasing. Race conditions, priority inversions, missed deadlines, jitter: they vanish the moment you stop to look.
The default debugging tool in 2026 firmware is still printing strings over a serial port, which itself perturbs timing and falls over under load. The blinking LED is the backup.
Instruction-trace tools run into the thousands-to-tens-of-thousands of dollars per seat, with hardware to match and a UX from another era. Program-flow visibility has been a luxury good.
Copilots can read your firmware source, but they have no idea what the chip actually did at runtime: the task that overran, the ISR that fired 10× too often, the mutex nobody released. They're guessing.
03 The solution
Each layer reinforces the next: the app feeds the agent, the trace engine feeds both, and frozen interfaces let all three move independently. Together they do for firmware what cloud observability did for web services.
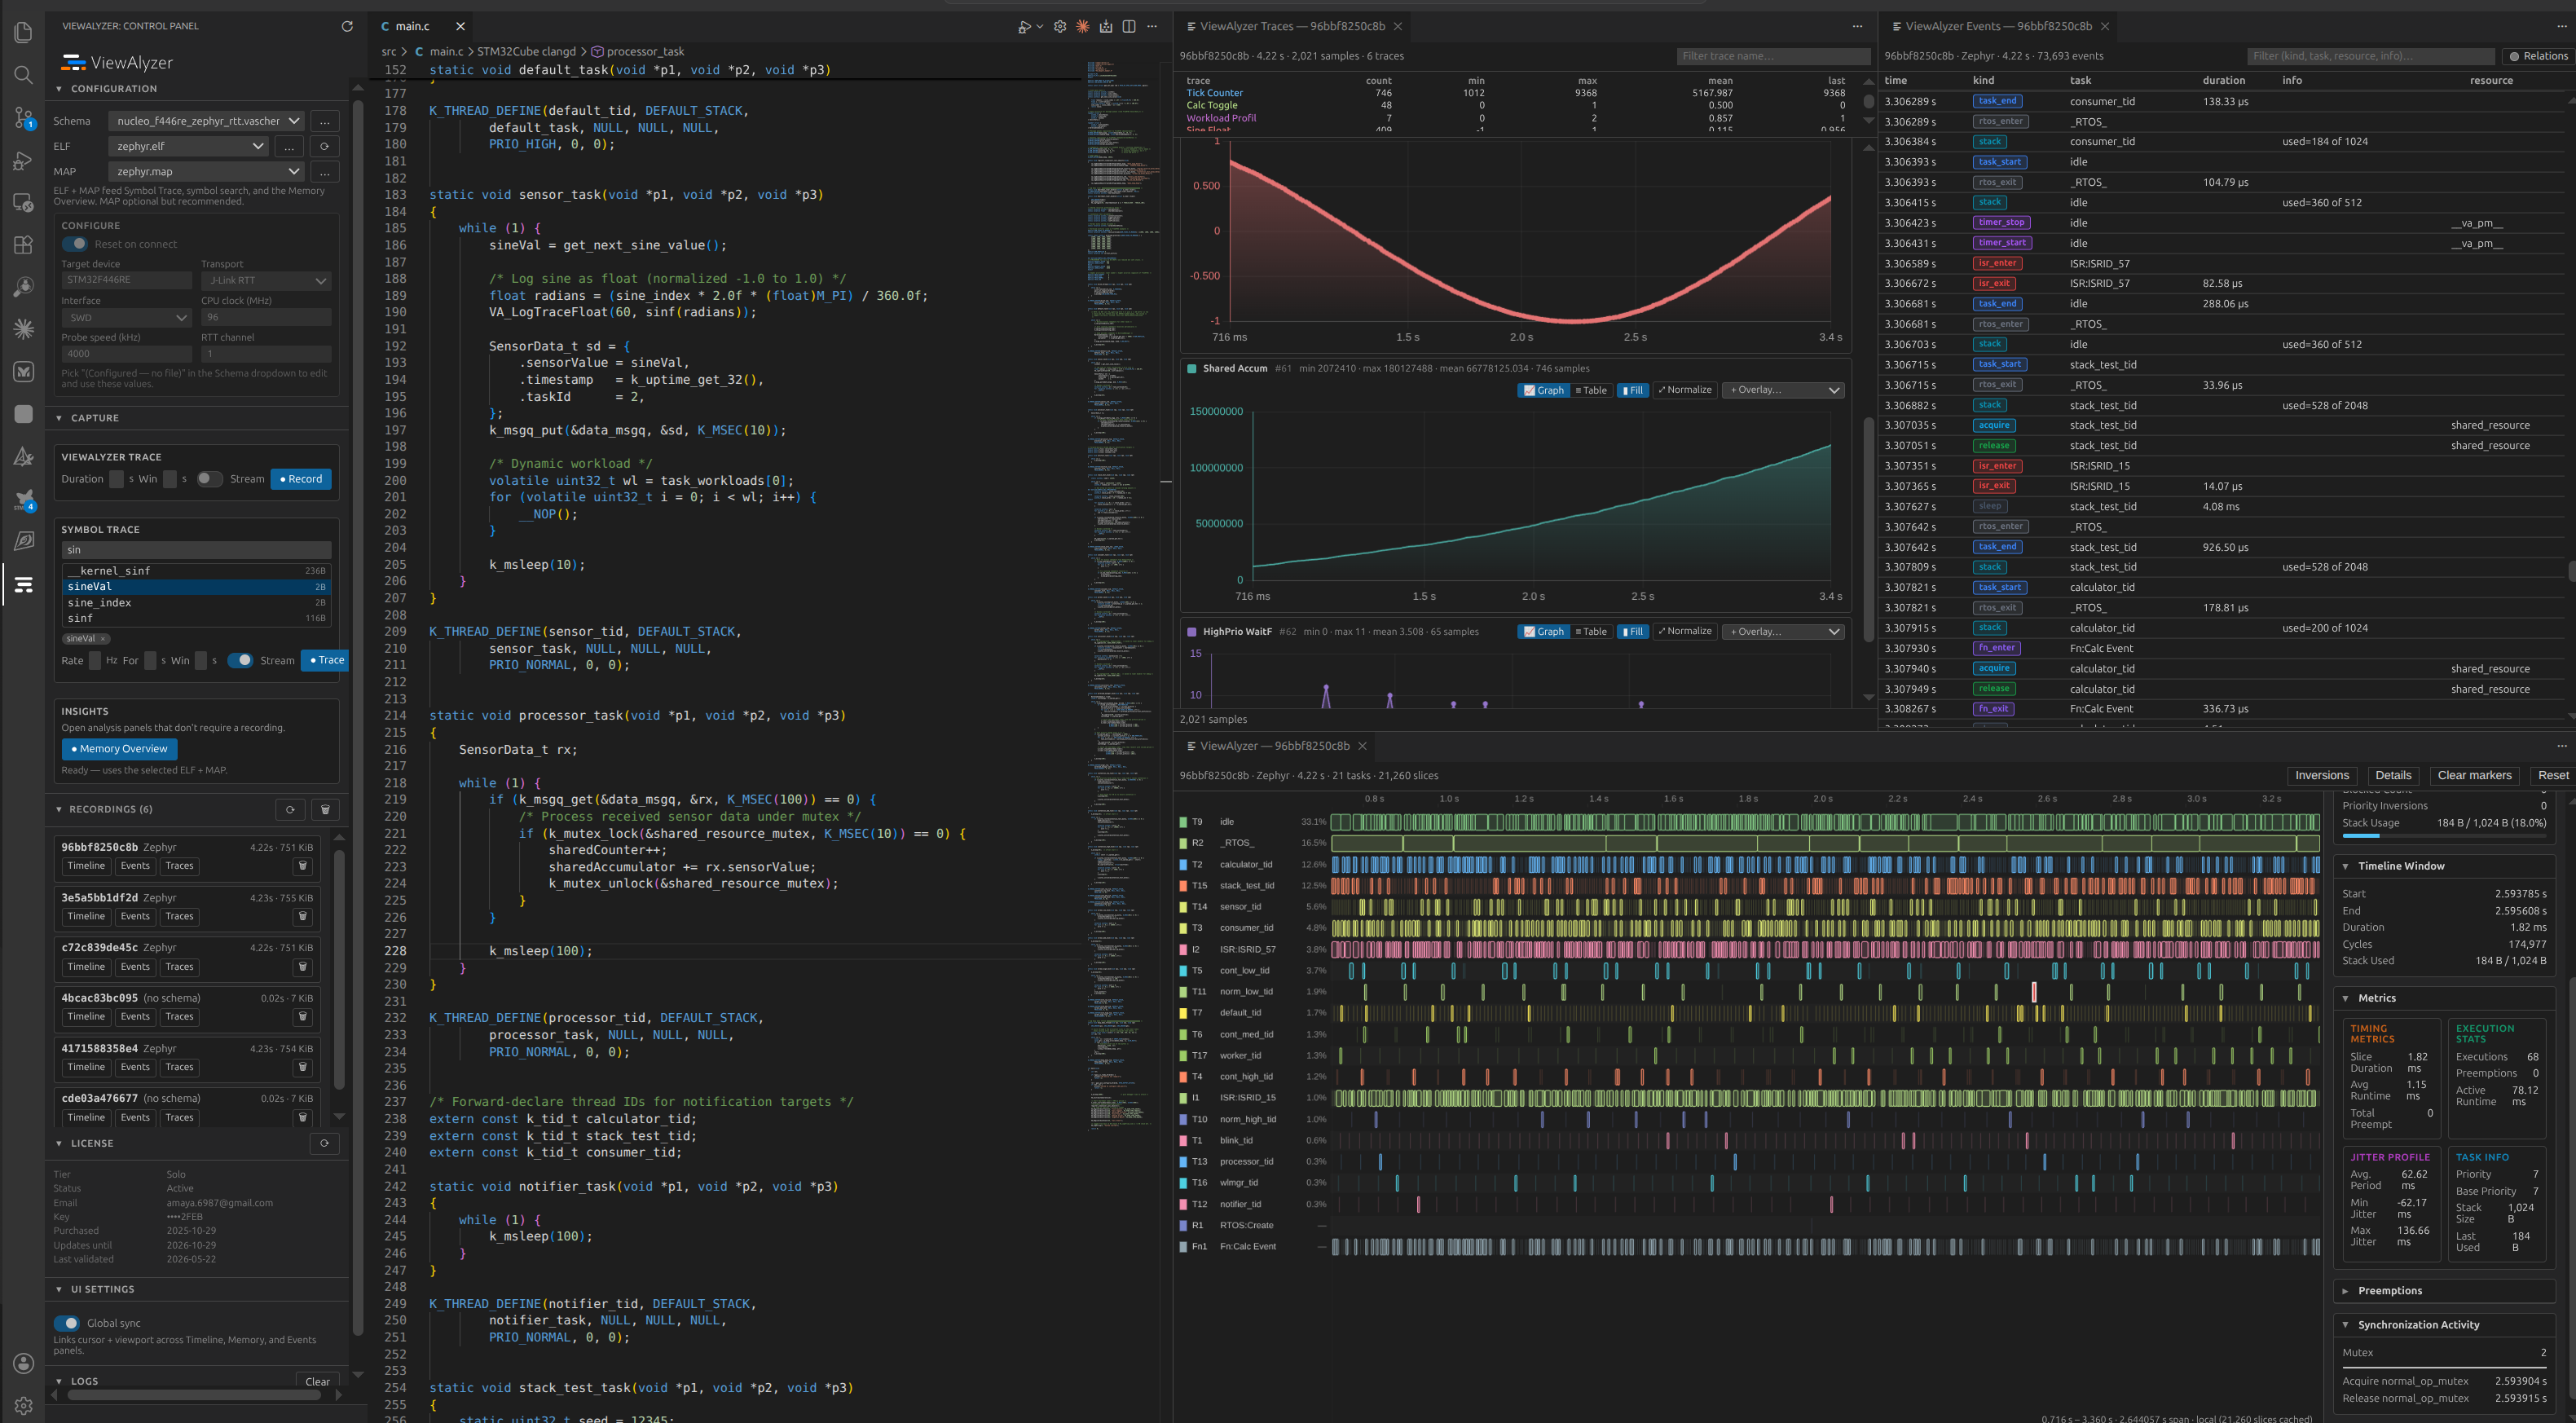
A native desktop app that connects to any standard debug probe and streams live runtime data over SWO/RTT, rendering a real-time picture of what the chip is doing as it runs.

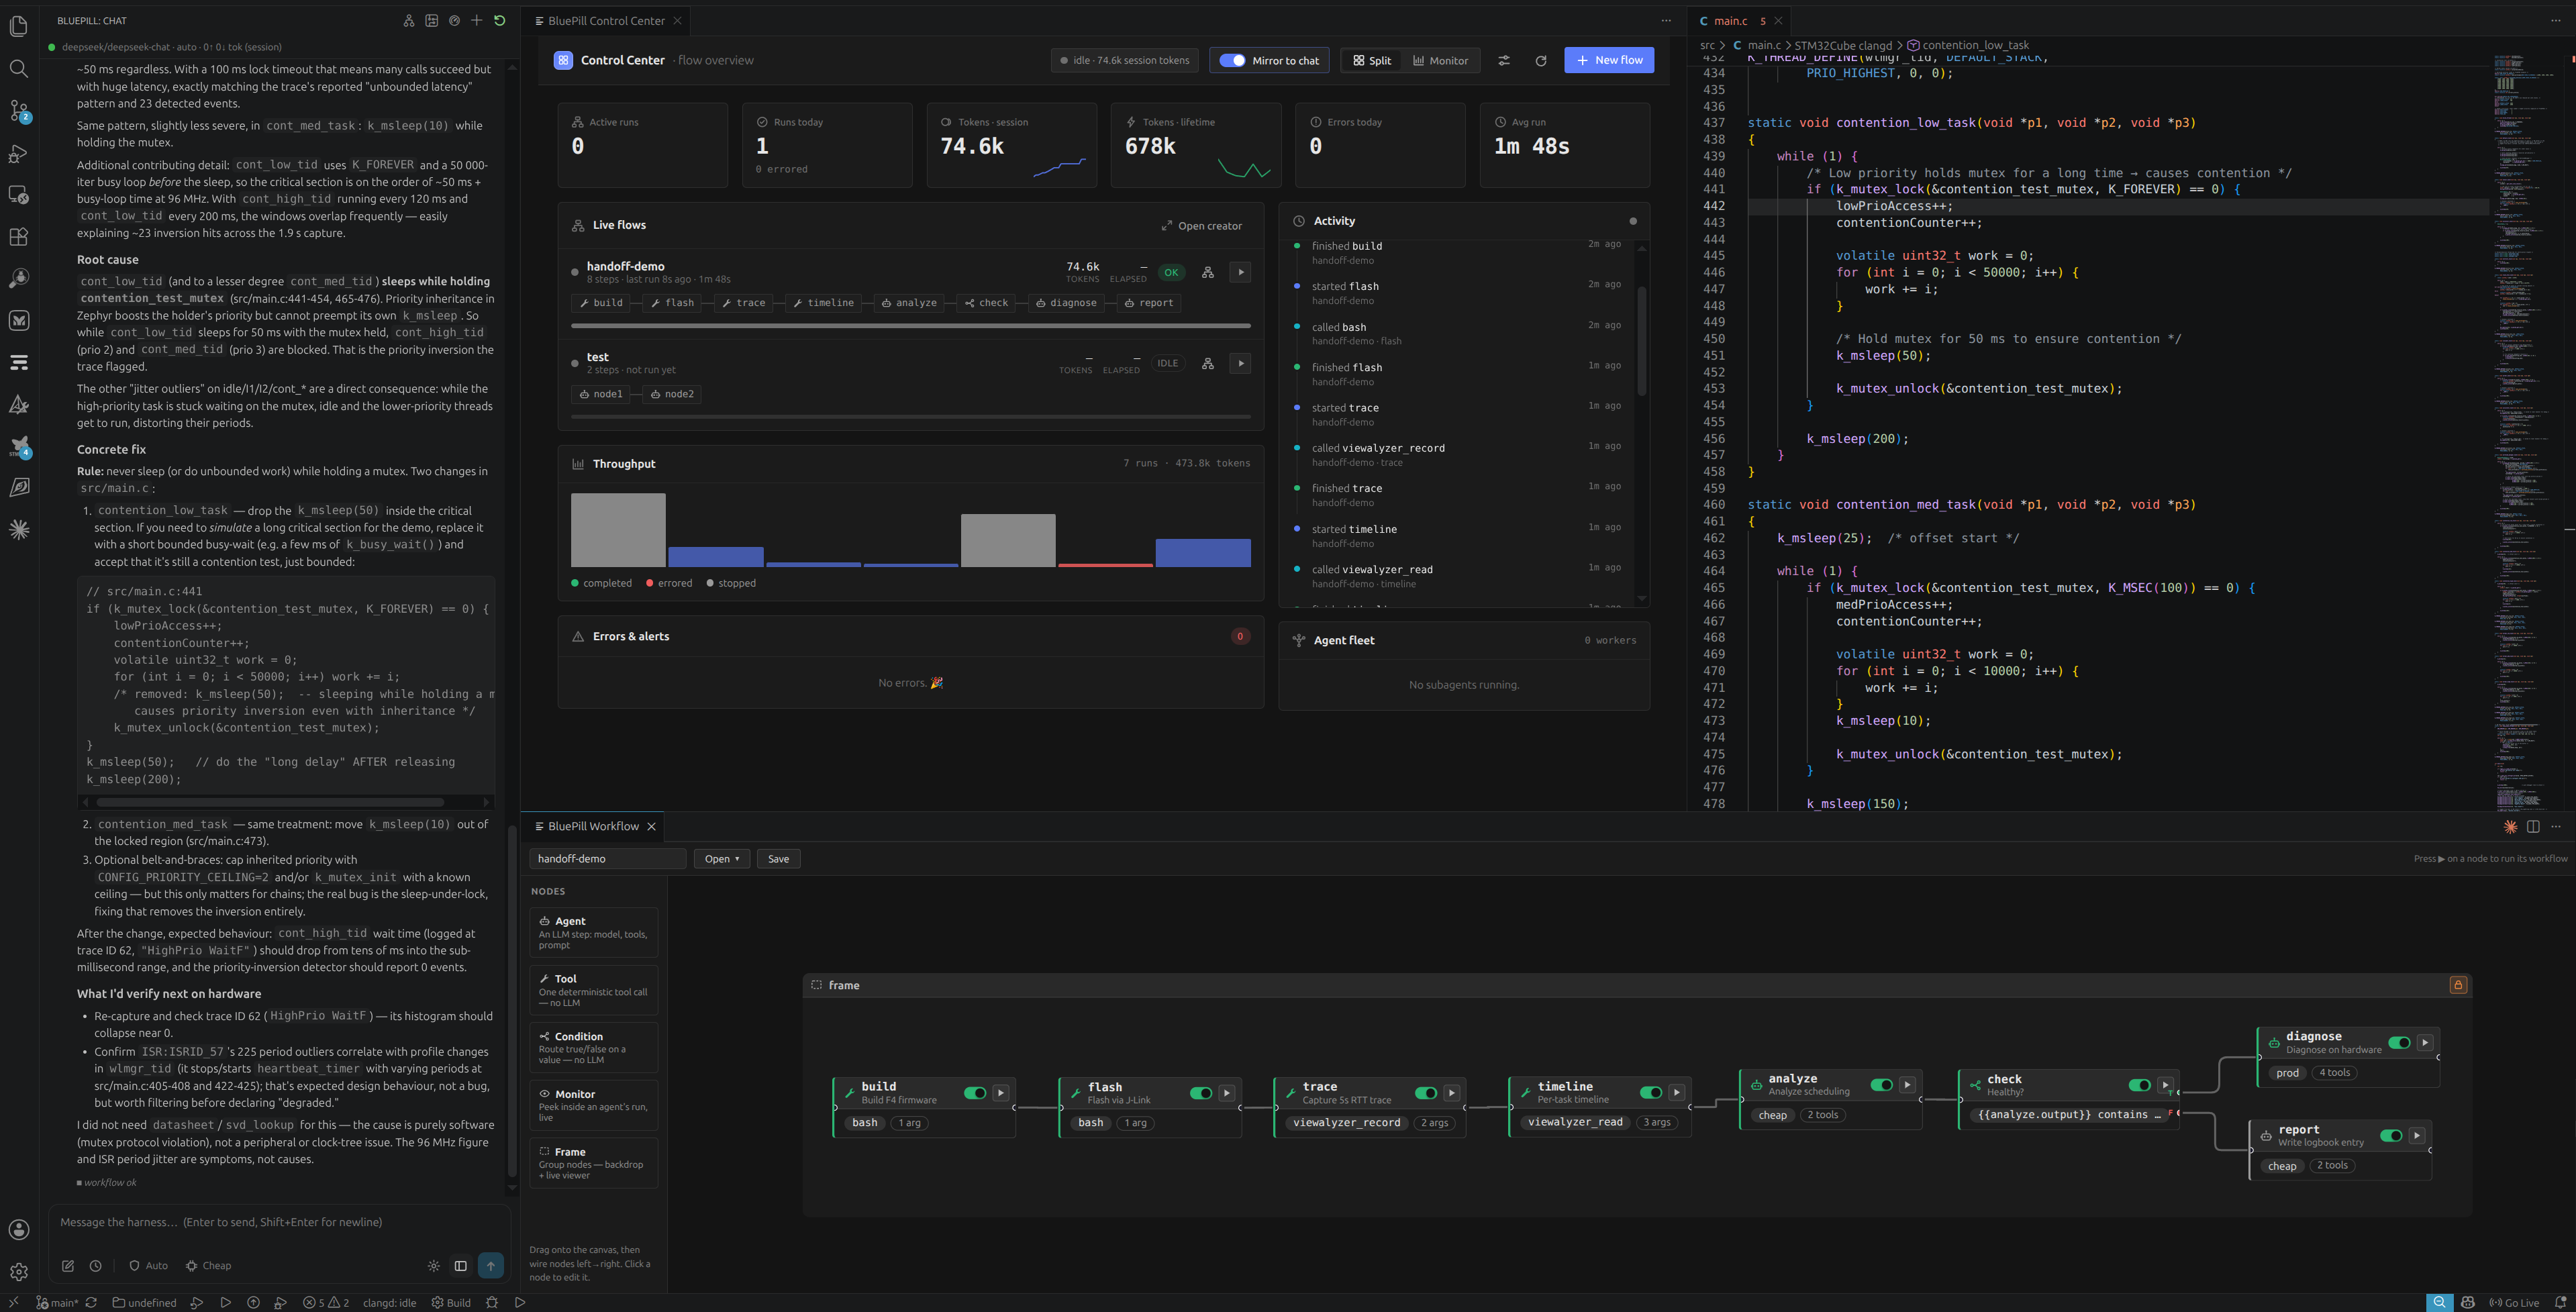
An MCP server + IDE integration gives an AI agent purpose-built tools to query a recording, and, critically, to query the exact view the engineer is looking at, in the same coordinate system.
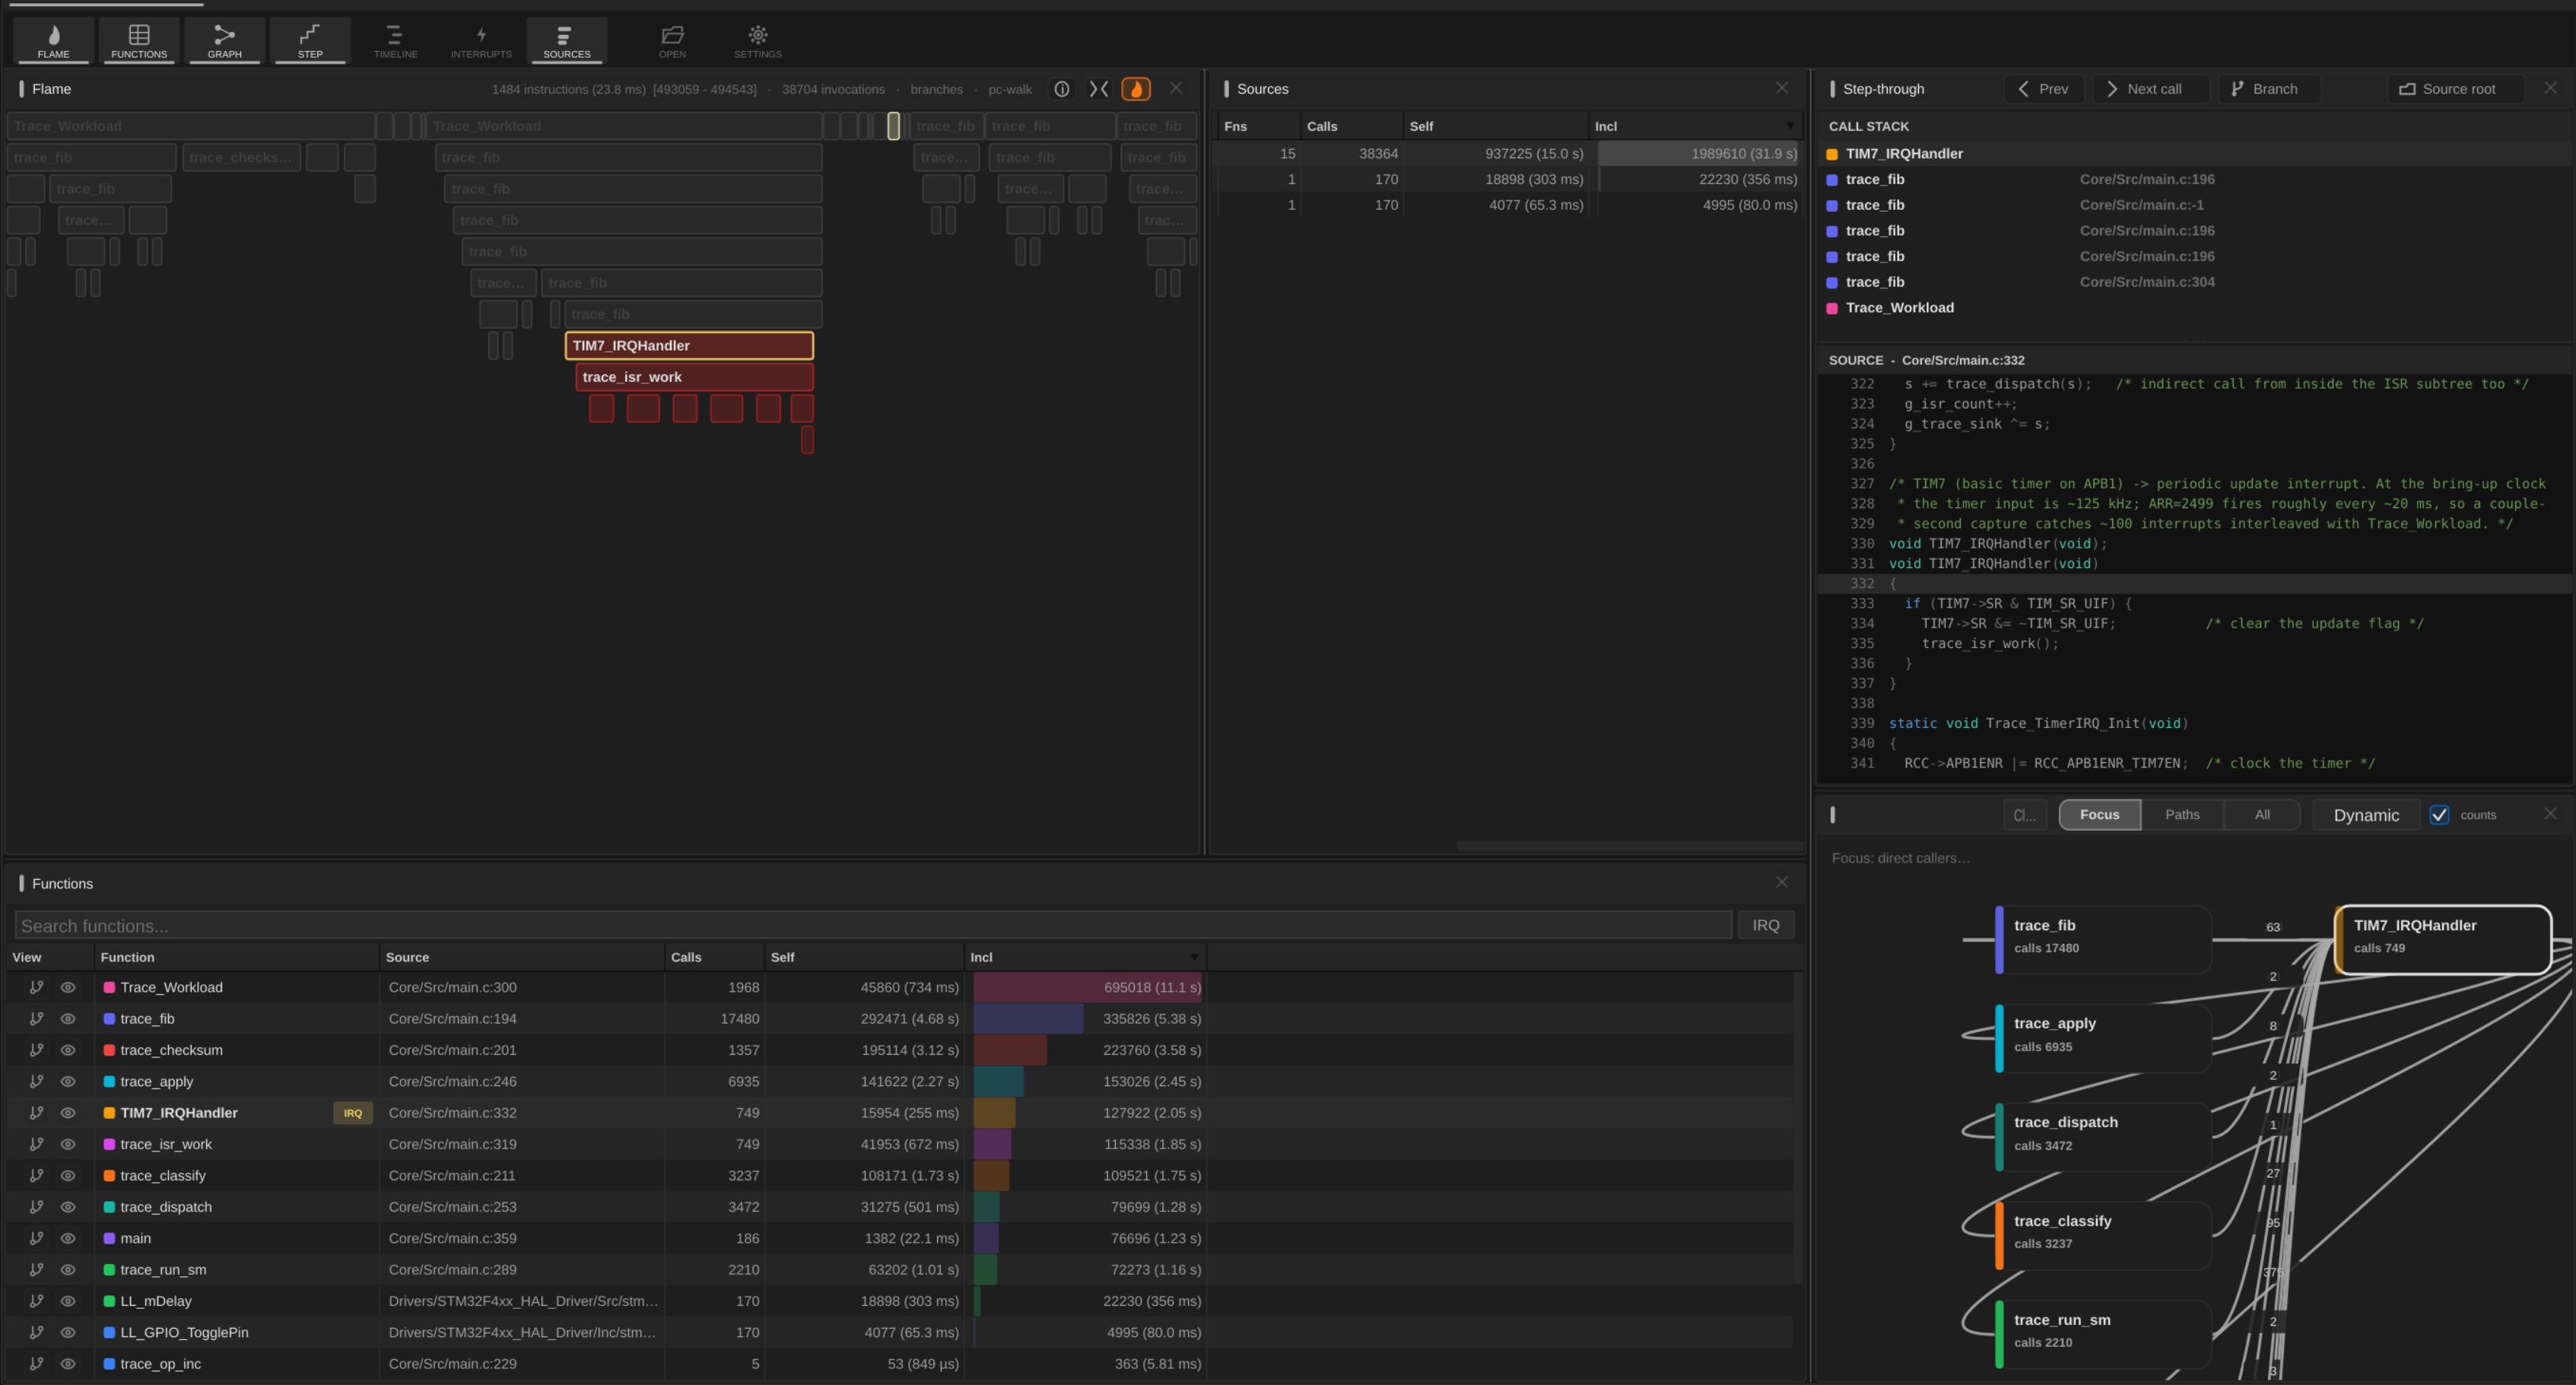
The deepest layer, and the moat. A capture probe sniffs the chip's 4-bit hardware trace port and a host decoder reconstructs the complete nested call tree of what actually ran, with zero firmware instrumentation, verified on STM32 F4/F7-class silicon.

04 The architecture moat
Two locked interfaces separate the chip-specific capture layer from everything above it. The hardware details stay below the line and the visualizer and agent stay portable, so new silicon and new probes slot in without disturbing the rest of the stack.
Supporting Cortex-M7 / M33 swaps one module behind the seam. The entire view, agent, and app are untouched. New chips are a module, not a rewrite.
The planned ViewAlyzer Core 1 lifts throughput ~100× over the proof-of-concept probe, and emits the exact same capture format, so the whole stack ships unchanged.
WCET hunting, interrupt-latency jitter, a concurrency bug finder, and cross-capture diff: timing-regression testing for firmware in CI, because the hard data already exists.
05 Why now
The copilots developers now expect have no runtime ground truth for firmware. We supply it, in a form an agent can actually reason over.
The incumbents have run a high-priced, low-velocity bench-instrument market for two decades, with little pressure to modernize. That leaves the field wide open for a software-defined, AI-native challenger.
Hardware tracing ships in the chips engineers already use. The bottleneck was never the chip, it was affordable capture and modern software. We built both.
FreeRTOS / Zephyr adoption keeps rising, and concurrency is exactly where visibility matters most and printf fails hardest.
06 Why us: the unfair advantages
07 The ecosystem today
Every serious software domain got both, except the tens of billions of chips running the physical world. ViewAlyzer is building them, on hardware we control, for the engineers everyone else overlooked.
And it isn't only our agent. Any team building AI for the physical world plugs into the same runtime ground truth. In a gold rush, ViewAlyzer sells the shovels.